 Menu
Menu
TIGER Events


- This event has passed.
Data + Excel = An Analytical Match Made in Spreadsheets (LIVESTREAM)
June 12, 2020 @ 12:00 pm - 1:00 pm
| TIGER Talk
Event Navigation

Please register by 8 pm, Thu June 11.
By 9 pm, we’ll send you a link to access LIVESTREAM.
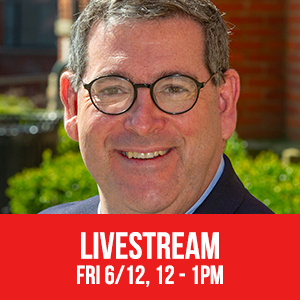
Excel can perform so many analytical tasks such as determining mode to median to mean, organizing data through pivot tables or VLOOKUPs, and displaying results in bar or line charts. Excel, though, can do so much more — including robust segmenting approaches. In this talk, Dr. Michael Levin will describe a few of these segmenting approaches including K-means and will show how Excel can generate this type of analysis.
As a professor at Otterbein University, Michael teaches a variety of Marketing courses including Marketing Analytics, a course dedicated to specific analyses including K-means and regression. He has also published several papers that rely on these analytical techniques to support his recommendations. During the summer, Michael teaches a day-long statistics workshop that remains free to members of the Ohio Program Evaluators’ Group. He has given presentations on various analytical topics including correlation, K-means, and how to teach analytics.
Michael earned his BBA in Marketing at The University of Oklahoma, his MA in Athletics Administration at The University of Iowa, and his PhD in Marketing at Texas Tech University.
Please join the LIVESTREAM early at 11:45 am. Introduce yourself to the group — and make new friends!
Thank you to our sponsor Crosswalk Energy.
This event has passed so registration is closed.
